
AI Agentification Index (AI²) — how soon AI Agents will replace a job?
< cross-posted on LinkedIn>
When Andrej Karpathy published his US Job Market Visualizer recently, the AI research community took notice. A treemap of 342 US occupations, colored by AI exposure, automation risk, and sized by employment. Clean. Immediate. When you look at Digital AI Exposure, you can see at a glance that software developers were in the hot red zone, while personal care aides, construction laborers, electricians, and plumbers were in the safe green zone. The reaction was predictable and palpable. And Karpathy deserved the attention. The visualization made a genuinely complicated question legible to a general audience.
But if you looked carefully, you noticed what was missing. The tool lets you toggle between four display modes (BLS projected growth, median pay, education requirements, and Digital AI Exposure), each a single LLM-scored dimension. The AI Exposure layer gives Software Developers a 9 and Cooks a 3, which is directionally reasonable. But it gives Commercial Divers the same score as Roofers, for entirely different reasons. Both scores are defensible on a single axis. Neither tells you why, or when, or at what cost. The occupational granularity was real. The analytical depth was just one prompt deep.
That’s not a criticism of Karpathy. He built a beautiful tool to provoke a conversation. But we’ve built a research framework — the AI Agentification Index (AI²) — to answer that.
The Question Karpathy Meant to Ask, and Didn’t Answer
The core question his visualizer raises is: which jobs will AI agents actually replace, and when?
The word “actually” is doing a lot of work there. Theoretical automability (whether a sufficiently capable AI can perform these tasks) is one thing. Actual agentification (Will AI agents be deployed to replace these workers in the next two to five years?) is another entirely.
The gap between those two questions is where most AI job displacement research falls apart. Frey and Osborne’s seminal 2013 Oxford study asked the first question. So did most of what followed, including Microsoft’s 2025 study on working with AI, and Anthropic’s recent report on Labor market impacts of AI. Karpathy’s visualizer is squarely in that tradition: feasibility-first, deployment-second.
Our AI Agentification Index (AI²) was built specifically to answer the second question.
What is AI Agentification Index (AI²)?
The AI Agentification Index (AI²) is a proprietary metric that scores 738 US occupations across six weighted dimensions on how soon AI Agents will replace them. We’re not going to give you the full formula, but the conceptual architecture is worth sharing because it represents a genuinely different philosophy from single-axis automation risk.
The six dimensions are:
- Automability: Feasibility of job role to be automated through Agentic AI capabilities at the task-level, scored against the O*NET task data. Can the actual tasks in this job description be performed by AI agents?
- Economic Viability: The dimension most models ignore. This is not “can AI do this?” but “what does it cost to deploy AI here?” A pure software agent replacing data entry is fundamentally different from an embodied robot replacing a commercial diver. We score this 1–5: pure software (5) to highly specialized robotics that commercially do not exist (1).
- AII (AI Impact Index): This third-party metric measures how AI might affect job roles based in the US, with the lowest score of AII (1) indicating the most impacted. This measure compares standard job task descriptions with more than 24,500 patents to calculate the AII for a job role. Please note that this is published by a third party, and we only use it in our calculations.
- LLL Index (Legal-Labor-Liability): The regulatory, union, and legal barriers to AI deployment. A surgeon and a paralegal might have similar task-level automability scores, but their LLL scores are radically different.
- Ethics Index: This score assesses the accuracy requirements for the job role, the necessity of human judgment, data privacy, equity concerns, and the severity of job displacement. This is the dimension that keeps mental health counsellors in the Low tier, despite these roles being highly conversational (and hence automatable).
- Precedence: Real-world evidence of AI deployment in this specific role. Not sector-level citations. Not the “AI is transforming healthcare” type of generalization. Actual documented deployment at the occupational scale.
The Precedence dimension is where the methodology diverges most sharply from the literature. It is also what allows our model to distinguish between roles that could be automated and roles that are being automated.
Where the 738 Occupations Land
After scoring AI² for 738 jobs, the 2026 distribution tells a clear story.
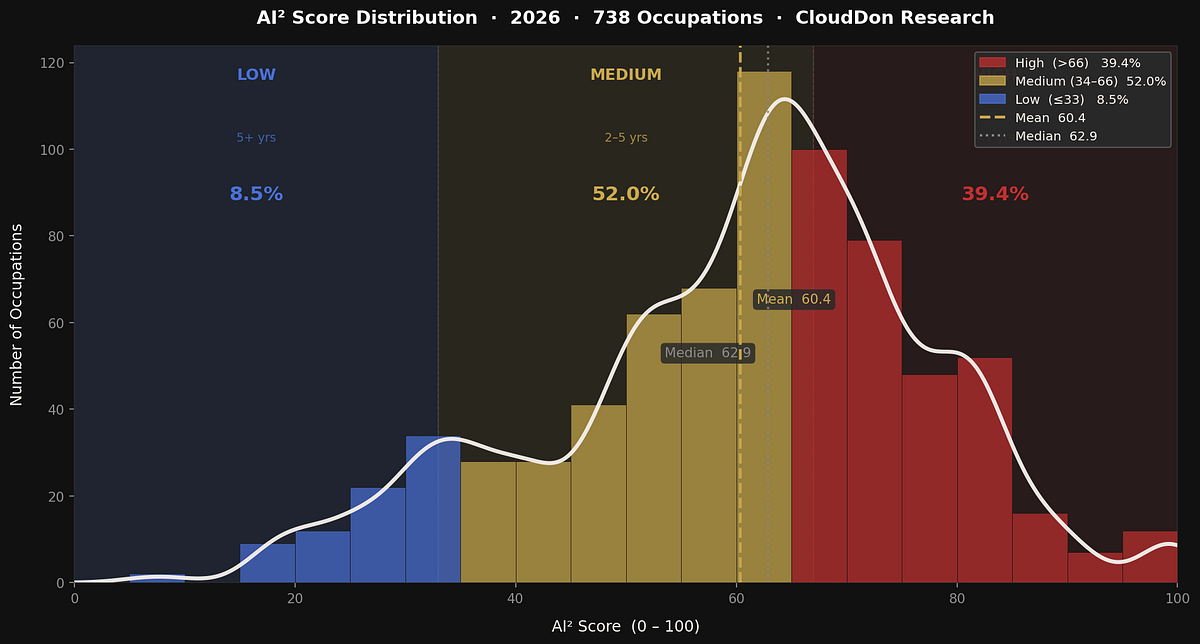
Figure 1: AI Agentification Index Score Distribution, 2026
The distribution is centered in the Medium tier with a mean of 60.4 and a median of 62.9. It is not, notably, a spike at the top — which is what you get when feasibility alone drives the score. The spread is genuine:
- 8.5% of occupations score Low (AI² ≤33). They are protected by genuine structural barriers: physical embodiment requirements, strong LLL environments, irreplaceable human judgment, or the absence of any deployment evidence
- 52.0% score Medium (AI² 34–66). They have meaningful AI exposure within the next five years, but real barriers remain
- 39.4% score High (AI² >66). AI disruption is most likely within two years for the specific job role
2025 vs. 2026: What Changed, and Why
This is the second year of scoring AI², which means we can track directional movement for the first time. We can see a trend.

Figure 2: AI Agentification Index, 2025 vs 2026
The headline number: mean rose from 53.0 to 60.4: a 7.4-point increase. The tier picture sharpens that story considerably.

Figure 3: AI Agentification Index Score Tier Distribution: 2025 vs 2026
The Low tier nearly collapsed. Roles that were protected by AI immaturity in 2025 are no longer protected by that argument in 2026. The High tier grew by over 10 points.
The biggest movers tell the story of where AI actually advanced.
Roles that dropped significantly in score reflect improved rigor, not a pessimistic reassessment of AI capability. Instructional Coordinators, Training & Development Managers, Insurance Underwriters, and Claims Adjusters all fell sharply. In 2025, they held inflated scores driven by optimistic sector-level assumptions about AI deployments. In 2026, with Precedence grounded in actual occupational-level evidence, those assumptions no longer held.
Roles that rose substantially reflect genuine growth in 2026 AI capabilities. For example, Market Research Analysts, where AI-powered insights platforms have become standard practice, have moved dramatically. Medical Records Technicians consolidated into the High tier as healthcare documentation AI reached genuine deployment scale.
The most important structural shift is in the Medium tier. It grew modestly in absolute terms, but its composition changed. Many roles that were firmly Medium-High in 2025 due to optimistic precedence assumptions have now been correctly reassessed. The 2026 Medium tier is more accurate than the 2025 one.
The Sectors That Surprise

Figure 4: Sector Radar — Automability (white), Precedence (grey), and AI Agentification Index (red)
The radar tells a richer story than bar charts alone. Each sector’s polygon shape reveals whether its AI² score is driven by genuine capability (white/Automability pushing out), actual deployment (grey/Precedence), or both. When Automability is high, but Precedence is low, you’re looking at a Capability-Led sector — technically ready, but the market hasn’t followed yet. Some sector findings confirm what everyone suspects. Computer & Math leads at 83.1. Office & Admin follows at 79.2. Dispatching, data entry, transcription, and clerical work are genuinely at risk.
Others are more interesting.
- Building & Grounds at 75.1 surprises most people. Janitors and Cleaners have 2.4 million workers at AI² 60 — moderate risk. But Landscaping Workers and Tree Trimmers score high. Why? Economic Viability is driven by declining robotics cost curves. Automated mowers and precision tree-trimming drones are in commercial deployment. Precedence scores here are defensible in a way that many initially assume they aren’t.
- Education & Library at 36.7 is lower than some expect, given the hype around AI tutoring. AI tutoring tools are real. But K-12 teachers carry high LLL scores, for obvious reasons (union density, state licensing, parent expectations), hence high Ethics scores reflecting child welfare and equity concerns, and genuine human-relationship requirements. The sector is not protected forever, though.
- Community & Social Services at 27.1 is the lowest sector mean in the dataset. Mental Health Social Workers score 6.3, nearly as low as any occupation can score. This reflects the convergence of the highest Ethics scores, high LLL barriers, and no precedent for AI agents replacing therapeutic relationships. This is not a modelling artefact. It is the correct answer.
Top 20 and Bottom 20
The top and bottom 20 are worth reading carefully because they reveal the model’s logic more clearly than any explanation.

Figure 5: Top 20 and Bottom 20 Occupations, 2026
The top 20 are entirely software and knowledge roles. Five job roles score 100. The next eight roles, with scores between 97 and 99, include Executive Secretaries, Application Developers, Computer Programmers, Software Developers, Medical Records Technicians, HR Assistants, and Medical Transcriptionists. All are highly automatable, pure software economics, low LLL friction, and genuine deployment precedent. The pattern is consistent and coherent.
- Notice that Models appear at rank 14 (91.2). AI-generated imagery and virtual influencers are no longer speculative. The Precedence score for this occupation reflects actual commercial deployment at scale, and it shows.
- Travel Agents at rank 15 (91.1) is another instructive case. This is a role that has already experienced significant AI disruption in booking and itinerary generation. The score reflects that reality.
The bottom 20 are equally instructive. Mental Health and Substance Abuse Social Workers lead the resistance at 6.3 — not because AI can’t converse, but because LLMs operating as therapists face maximum Ethics barriers, meaningful LLL restrictions, and zero established precedent at the occupational scale. Marriage and Family Therapists follow at 9.0.
- Commercial Divers at 18.4 is a case worth highlighting specifically. This role scores near the bottom not because it lacks automability potential in a distant future, but because Economic Viability is 1 — there are no commercially deployed AI systems that weld steel underwater, install pilings, or conduct hull inspections in unstructured deep-water environments.
- Pile-Driver Operators at 17.0 and Construction Managers at 17.8 reflect the same logic: outdoor, physically unstructured, safety-critical work that no deployed AI system handles today.
Where We Diverge from Microsoft and Anthropic
Microsoft’s ‘Working with AI’ and Anthropic’s ‘Labor market impacts of AI’ report are the two most widely cited industry reports. Both are valuable. But neither answers the question we’re trying to answer.
- Microsoft analyzed a dataset of 200k anonymized conversations with Microsoft Bing Copilot to measure AI applicability to occupations. That’s useful for understanding enterprise AI uptake. It’s not a methodology for scoring which specific occupations are at risk of displacement. Their framing is augmentation-optimistic: AI as a productivity layer. But our AI² is displacement-realistic: AI as a labor replacement signal.
- Anthropic’s analysis infers occupation exposure to AI from actual Claude usage patterns and theoretical LLM capability. This is methodologically clever. But LLM usage patterns are inherently biased toward language-heavy, software-accessible work. The analysis understates physical-role risk: it can’t see the robotic automation converging on manufacturing, logistics, and service roles that don’t use Claude yet.
The differentiating contribution of AI² is the Economic Viability × Precedence interaction. A role can score high on theoretical automability and still be correctly classified as Low or Medium risk if deployment is economically infeasible or if no actual deployment evidence exists at the occupational scale. This is what prevents both the false positives that plagued Frey & Osborne-era models and the false negatives that LLM-centric analysis produces.
The Treemap
We also built an interactive treemap for the full 738-occupation dataset, in lines of what Karpathy demonstrated is possible.

Figure 6: AI Agentification Index Treemap, 2026
The size of each box reflects the employment data from the BLS May 2024 Occupational Employment and Wage Statistics (152 million workers across 738 occupations). Color maps the AI² score through a continuous gradient: navy to blue (Low), brown to amber to gold (Medium), maroon to red (High). Every occupation, in its correct position, is visible at once.
The treemap has three display modes: AI² Score, Automability, and Precedence, so you can see separately what drives the overall score. If you switch to the Precedence mode, you immediately see which roles the model estimates to have actual deployment evidence versus which are theoretically automatable but practically untouched. That gap between Automability and Precedence is where the interesting strategic questions live.
It is, we think, what Karpathy’s visualization would look like with the second layer of the question properly answered.
What Should You Actually Do With This?
AI² is a risk map, not a forecast. The score tells you where the pressure is coming from and how fast it is. What you do with that information depends on whether you’re running an enterprise, advising on policy, or navigating your own career.

Figure 7: The Agentification Frontier, 2026
If you’re leading an organization:
- Start with your Prime Target roles. The 243 occupations sitting in the upper-right of the Agentification Frontier (high automability, high precedence, mean AI² 71.3), such as Data Entry Keyers, Dispatchers, Medical Records Technicians, HR Assistants, Executive Secretaries: these aren’t future risk. They are present-tense. AI agents are already doing this work at scale in peer organizations. If you haven’t automated/agentified these roles using AI, you’re paying for manual effort that is already automated/agentified elsewhere.
- Don’t confuse the Medium tier (52% of roles) with safety. General & Operations Managers (AI² 65), Customer Service Representatives (62), and Financial Analysts (61) are all Capability-Led: the technical case for automation is already proven, the market just hasn’t caught up yet. That gap closes. Augmentation is the right frame for now, but design your workflows assuming AI takes the automatable substrate, and humans retain the judgment layer.
- Watch your LLL scores as a leading indicator of regulatory change. Roles currently protected by legal or union friction are not permanently protected. The EU AI Act and US state-level AI transparency laws are live variables in the model.
If you’re a worker or career planner:
The most important distinction in the data is not High versus Low. It’s why a role scores Low. There are two kinds of low-scoring occupations, and they are very different bets.
- Some roles score Low because the work is genuinely hard for AI: physical, unstructured, relational, and ethically loaded. Mental Health Counsellors (6.3), Physical Therapists (22), Construction Managers (17.8) — these are protected by the nature of the work itself. That protection is durable.
- Others score Low primarily because regulatory or institutional barriers are suppressing deployment. Those barriers are not permanent. A role that scores 30 because of LLL friction today may score 70 in five years if the regulatory environment shifts. Know which kind of Low you’re in.
If you’re early in a career, the occupations sitting in the lower left of the frontier are the ones most worth building toward.
If you’re thinking about policy:
- The tier shift data carries a specific warning. The Low tier nearly collapsed between 2025 and 2026, down from 24% to 8.5% of occupations. Roles that were protected by AI immaturity are losing that protection faster than most policy timelines anticipate. Reskilling programs built around 2023-era displacement assumptions are already behind.
- The LLL negative weight in the AI² formula is a policy instrument: it quantifies the protective effect of existing regulatory frameworks. The occupations where Ethics and LLL scores are holding AI² scores down, such as education, healthcare, and legal services, are benefiting from policy infrastructure that was not designed with AI in mind but is doing real protective work. Weakening those frameworks has a measurable cost.
What Comes Next
The 2027 edition will address three open questions that the current model doesn’t fully resolve.
- First, agentic AI acceleration. Multi-step AI agents capable of sustained autonomous work are entering production. The distinction between “AI tool” and “AI agent” matters enormously for displacement timelines, and our current scoring doesn’t fully capture the difference between Copilot-style assistance and fully autonomous task completion.
- Second, hardware cost curves. Our Economic Viability scores for physical roles assume current robotics economics. Those are changing faster than most people expect. Roles that score Econ=2 today because embodied deployment is expensive may be Econ=3 or Econ=4 by 2027.
- Third, regulatory response. The EU AI Act, US state-level AI transparency laws, and sector-specific regulations are already affecting LLL scores. These are not static. They are the most volatile dimension in the model.
The AI² Agentification Index full dataset, interactive treemap, and 2026 research report are available for purchase. For licensing, enterprise access, or methodology consultation, contact research@clouddon.ai. Subscription plans automatically provide access to the dataset and the report.